First steps with p5.js
This tutorial will take you through the steps necessary to create your first p5.js sketch and upload it to the Internet.
What is p5.js?
p5.js is a library and set of tools that make it easy to use the JavaScript programming language for creative coding. It’s based on Processing, a creative coding environment originally developed by Ben Fry and Casey Reas. One of the primary goals of Processing (and projects based on Processing) is to make it as easy as possible for beginners to learn how to program interactive, graphical applications (while also providing powerful tools for experts).
The advantage of using the JavaScript programming language is its broad availability and ubiquitous support: every web browser has a JavaScript interpreter built-in, which means that p5.js programs can (generally) run in any web browser. Additionally, the JavaScript language is defined by an international standard and most JavaScript interpreters (including those that run inside of web browsers), are open-source and freely available. No one “owns” JavaScript, and anyone can use it for free.
Another important idea from Processing is that it should be easy for programmers to create software prototypes very quickly, to try out a new idea or see if something works. For this reason, Processing (and p5.js) programs are generally referred to as “sketches.” We’ll use this nomenclature in this class.
What software to use
There are a number of ways to write p5.js sketches. Because p5.js is just a JavaScript library under the hood, you can include it in any regular web page, and even use it in conjunction with other JavaScript libraries. The official tutorial suggests downloading a separate text editor (like Brackets or Atom) and working with your p5.js source code just like any other programming language. Which is fine!
In this class, however, we’re going to use the p5.js web editor, a web-based programming environment specifically built for p5.js. It should work in nearly any web browser!
Anatomy of the web editor
When you load the web editor, you can get started right away. But I recommend making an account, which will allow you to save your work and share it with other people. Here’s what the web editor looks like and an explanation of the important moving parts. (There are other features of the web editor interface that we’ll discuss later. Also note that as of this writing the web editor is under heavy development and the way it looks when you read this might be different from how it looks in the image below.)
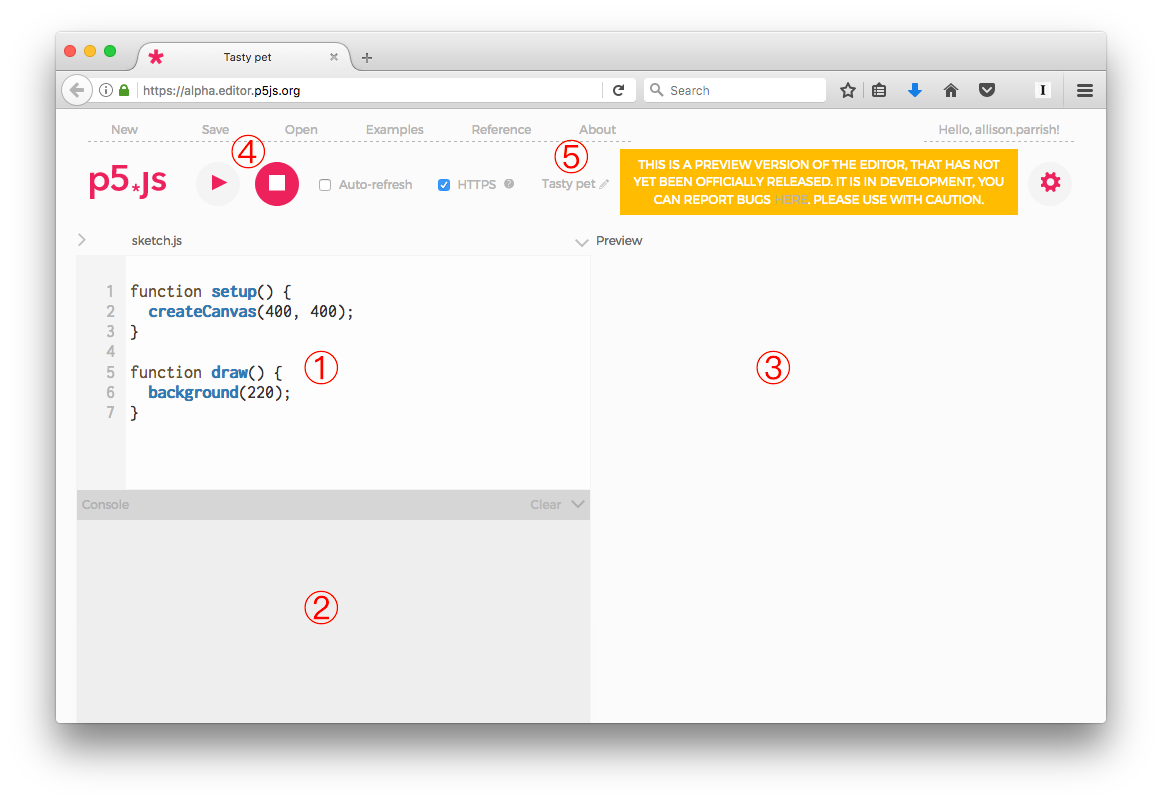
- The “code” pane. This is where you type your p5.js code.
- The “console” pane. This is where error messages from your code show up. you
can also use the
console.log()function to make text appear here while your program is running. (This is helpful for debugging purposes, and we’ll discuss it more later!) - The “preview” pane. Your sketch will show up here!
- Controls. Press the “Play” button (▶) to “run” your sketch. Press “Stop” (⬛︎) to terminate the sketch.
- The name of your sketch. Click the little pencil icon to the right of the name to edit it. (When you create a new sketch, a random name is generated for you. The web editor uses this library to generate the names, if you’re curious!)
Your first sketch
Okay, the preliminaries are out of the way! Let’s get a-programmin’. Copy the source code from the example below (on the left-hand side) and paste it into your p5.js editor. Press the “Play” button; a window will open, and you should see something that looks like what you see on the right-hand side below.
function setup() {

}

function draw() {
  ellipse(50, 50, 60, 60);
}
Congratulations! You’ve made a simple computer program.
So what’s going on here?
You made a computer program, but what exactly happened? Here’s a little breakdown (simplifying a little):
ellipse(50, 50, 60, 60);is an example of a function call. p5.js comes with several dozen built-in “functions” that perform various tasks, like drawing shapes to the screen or calculating values using mathematical formulas. Learning how to program in p5.js is mostly about learning these commands and what they do. Theellipsefunction, in case you hadn’t guessed, draws an ellipse to the screen.ellipseis the function’s name. Functions are always followed by a pair of parentheses; inside these parentheses are a comma-separated list of values. These values are called the function’s parameters. Every function uses its parameters in a slightly different way, and part of learning a function is learning what its parameters mean.- In the case of
ellipse, the first parameter is the X coordinate of the ellipse, the second parameter is the Y coordinate, the third parameter is the width of the ellipse and the last parameter is the height of the ellipse. - The function call ends with the semicolon (
;). You should put a semicolon at the end of every function call. - You can put as many function calls as you want in between the line that reads
function draw() {and the}that follows it. (We won’t talk about whatfunction draw()means for now, or what the curly braces mean. Just know that you can put more stuff in between those curly braces if you want more stuff to happen.)
You can find a big list of p5.js functions in the p5.js reference. For now, we’re going to focus just on the most simple functions for drawing shapes to the screen. As the course progresses, we’ll learn about other functions that do more interesting things.
Add another shape
This is pretty boring so far. Let’s give our ellipse a friend to play with.
function setup() {

}

function draw() {
  ellipse(50, 50, 60, 60);
  rect(40, 40, 35, 45);
}
The rect() function draws a rectangle to the screen. The parameters to the
rectangle function have the following meanings:
- parameter 1: the X position of the rectangle’s upper left-hand corner
- parameter 2: the Y position of the rectangle’s upper left-hand corner
- parameter 3: the rectangle’s width
- parameter 4: the rectangle’s height
Notice that the functions are called in the same order as they’re drawn. That means that the rectangle gets drawn on top of the ellipse. If you reversed the order of the commands, the ellipse would be drawn on top instead:
function setup() {

}

function draw() {
  rect(40, 40, 35, 45);
  ellipse(50, 50, 60, 60);
}
Background color
The background() function sets the background color for the entire sketch.
Call it first in the draw() block, like so:
function setup() {

}

function draw() {
  background(0);
  ellipse(50, 50, 60, 60);
  rect(40, 40, 35, 45);
}
The background function takes a single parameter, which is a value from 0 to
- The value determines the shade of grey that the background will appear. 0
means black, and 255 means white; other values refer to all of the intervening
shades of grey. For example, use
50for a nice slate color:
function setup() {

}

function draw() {
  background(50);
  ellipse(50, 50, 60, 60);
  rect(40, 40, 35, 45);
}
Or 240 for a smoky light grey:
function setup() {

}

function draw() {
  background(240);
  ellipse(50, 50, 60, 60);
  rect(40, 40, 35, 45);
}
If you call the background function with three values, you can set the
background to a color of your choice (not just a shade of grey). The three
parameters correspond to the red, green and blue components of the given
color. (See the Processing color
tutorial for an explanation of
why the color is specified with red, green and blue, and why the numbers range
from zero to 255.)
A good place to look for color values is Wikipedia’s list of
colors. Click on any
color, like Cornflower blue,
and you’ll find (in the infoboxes on the right-hand side) the RGB values for
that color. The infobox says that the RGB value for Cornflower blue is (100,
149, 237); let’s use those values to make the background of our sketch
Cornflower blue:
function setup() {

}

function draw() {
  background(100, 149, 237);
  ellipse(50, 50, 60, 60);
  rect(40, 40, 35, 45);
}
Coordinates
By now you’re asking yourself: now that I can set the background of my
sketches, they seem awful… small. Can I made it any bigger? Also, those
numbers in a call to ellipse or rect specify positions and dimensions. But
what are the units? If 50 is some shape’s X position, what’s the unit?
Meters? Furlongs? Lachters?
Spats?
No! Distances in Processing are measured in pixels.
Nearly all digital displays are broken up into tiny squares called pixels. Normally, each pixel is itself an actual, tiny, physical device that can display a color. The screen on your device right now likely has hundreds of thousands if not millions of these tiny devices. Each one is exactly the same size, and together they form a “grid.”
Every p5.js sketch has a size in pixels—the number of pixels wide it is, and the number of pixels tall. By default, the sketch is 100 pixels by 100 pixels. (Time was that this was a fair number of pixels. The original Game Boy’s display, for example, was 160x144 pixels. But in this contemporary era of “retina” displays, it’s not much.)
The pixel in the far upper left-hand corner is designated as the pixel at
coordinate 0, 0. As you move further left, the X coordinate increases.
As you move further down, the Y coordinate increases, so that the coordinate
of the middle of the sketch is 50, 50 and the coordinate at the lower
right-hand corner is 100, 100. (If you’re used to Cartesian coordinates, this
seems weird, since normally the Y value decreases as you move down. But
you’ll just have to get used to the way Processing does it for the purposes of
this class.)
For more information and diagrams, see the Processing coordinate system tutorial.
Change the size of your sketch
Up until now we haven’t talked about that strange function setup() { thing up
at the top of the sketch’s source code. Well, let’s talk about it now!
There’s one special function that you can put inside of there, called
createCanvas(). This function sets the size (in pixels) of your sketch.
Let’s take the example above and give it some room to breathe:
function setup() {
  createCanvas(400, 400);
}

function draw() {
  background(100, 149, 237);
  fill(255);
  ellipse(50, 50, 60, 60);
  rect(40, 40, 35, 45);
}
(Ignore the call to fill(); we’ll discuss it further below.)
The first parameter to the createCanvas() function specifies the width of
the sketch, and the second specifies its height (again, in number of pixels).
Now that our canvas is bigger, let’s spread our shapes out a little bit!
function setup() {
  createCanvas(400, 400);
}

function draw() {
  background(100, 149, 237);
  fill(255);
  ellipse(170, 150, 250, 250);
  rect(150, 95, 200, 250);
}
Fill and stroke
p5.js lets you control not just the shapes that you draw but also two critical
aspects of those shapes’ appearance: what color they are, and what color their
outline is. You can set the color of a shape with the fill() function.
Just as with background(), you can call fill with either one parameter to
set its greyscale color, like so:
function setup() {
  createCanvas(400, 400);
}

function draw() {
  background(100, 149, 237);
  fill(50);
  ellipse(170, 150, 250, 250);
  rect(150, 95, 200, 250);
}
Or you can call it with three values, to set the color using RGB values. Let’s try a nice shade of carmine:
function setup() {
  createCanvas(400, 400);
}

function draw() {
  background(100, 149, 237);
  fill(252, 108, 133);
  ellipse(170, 150, 250, 250);
  rect(150, 95, 200, 250);
}
Notice that the color in the fill() command applies to every shape that gets
drawn after it’s called. To change the color for subsequent shapes, include a
second call to fill() right before you call the function for the shape whose
color you want to be different:
function setup() {
  createCanvas(400, 400);
}

function draw() {
  background(100, 149, 237);
  fill(252, 108, 133);
  ellipse(170, 150, 250, 250);
  fill(255);
  rect(150, 95, 200, 250);
}
You can change the color of the outline of the shapes using the stroke()
command. Again, like background() and fill(), you can use stroke() either
to set the greyscale value, or to set an RGB color. Also like fill(), a call
to stroke() sets the stroke color for all shapes that follow, unless you call
the stroke() function again:
function setup() {
  createCanvas(400, 400);
}

function draw() {
  background(100, 149, 237);
  stroke(252, 108, 133);
  ellipse(170, 150, 250, 250);
  stroke(240);
  rect(150, 95, 200, 250);
}
There’s also a function called strokeWeight() which allows you to set the
width of the stroke. The width is measured in pixels, and like fill() and
stroke() it applies to every function called after it:
function setup() {
  createCanvas(400, 400);
}

function draw() {
  background(100, 149, 237);
  strokeWeight(20);
  stroke(252, 108, 133);
  ellipse(170, 150, 250, 250);
  stroke(240);
  rect(150, 95, 200, 250);
}
Here’s an example that puts it all together!
function setup() {
  createCanvas(400, 400);
}

function draw() {
  background(105, 109, 125);
  strokeWeight(10);
  stroke(111, 146, 131);
  fill(141, 159, 135);
  rect(50, 50, 100, 100);
  strokeWeight(5);
  stroke(141, 159, 135);
  fill(205, 198, 165);
  ellipse(200, 200, 250, 250);
  strokeWeight(10);
  stroke(205, 198, 165);
  fill(240, 220, 202);
  rect(250, 250, 100, 100);
}
(Color scheme generated automatically with Coolors. I don’t advocate this site, it was just the first result when I googled “color scheme generator”)
Other shapes
Here are some other functions that draw shapes. Each of them works a little bit differently from the next, so consult the reference page for information and instructions.
When something goes wrong
Programming is persnickety work, and it’s easy to get the syntax wrong. (Easy for beginners especially, since you haven’t quite learned yet how to reason about how the syntax works.) If something goes wrong, you’ll get an error message. The error message will appear in that little box beneath the source code editing area, called the “console.”
If you can’t find where the problem is, don’t fret! The error message will give you some hints. The number at the beginning of the error tells you the number of the line that p5.js thinks the problem is on. (Sometimes it’ll be off by a line or two, so you’ll have to hunt around.) The message gives you some idea of what the problem is, although the description is filtered through the weird language of programming language parsers.
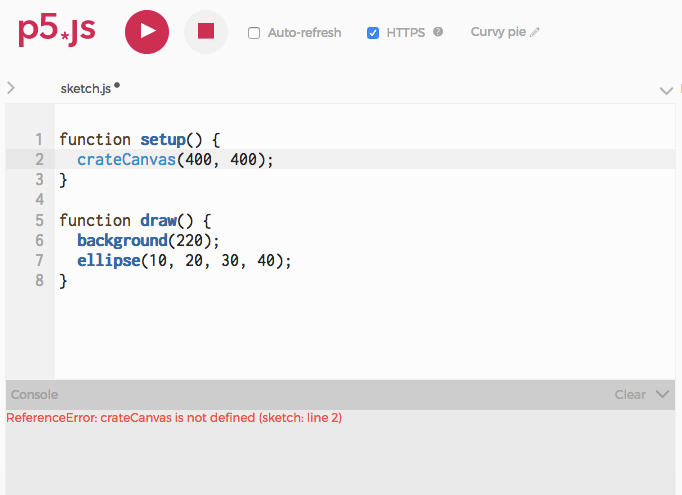
This error message shows that there’s a problem on line 2: I accidentally
spelled it crateCanvas instead of createCanvas, and JavaScript is helpfully
informing me that it has no idea what crateCanvas is. (When JavaScript says
something “is not defined,” that’s what it means. JavaScript only knows about
built-in objects, variables and functions you’ve defined, and variables and
functions in the libraries you’re using, like those you’re learning about in
p5.js.)
Sharing your work
You can share your work right from the web editor. In the web editor’s File
menu, select Share. You’ll see a dialog box with three different boxes whose
contents you can use to share what you’ve made with other people. Here’s how
they work:
- Embed: If your blogging software supports it, you can just copy this code and
paste it right into your blog post. (The code is an
iframe, which is an HTML tag that tells a browser to show the content from another site in the middle of whatever page the code occurs in.) - Fullscreen: This URL leads to a version of your sketch that only displays the output (what we’ve been calling the “preview pane”). The word “fullscreen” is sort of a misnomer, since it doesn’t actually take up the full screen unless you use your browser’s “Enter Full Screen” function.
- Edit: This links to your sketch in the web editor. Use this when you want to share your code with other people.